Wilhelm Lexis: The Statistician Who Pioneered Viewing Population Data Through the Dimension of Time
In the fields of statistics and demography, there is a tool that demographers around the world still use today to illustrate events such as births and deaths across different age cohorts: the Lexis diagram. It is named after its creator, the German economist and statistician Wilhelm Lexis.
A Diverse Academic Life
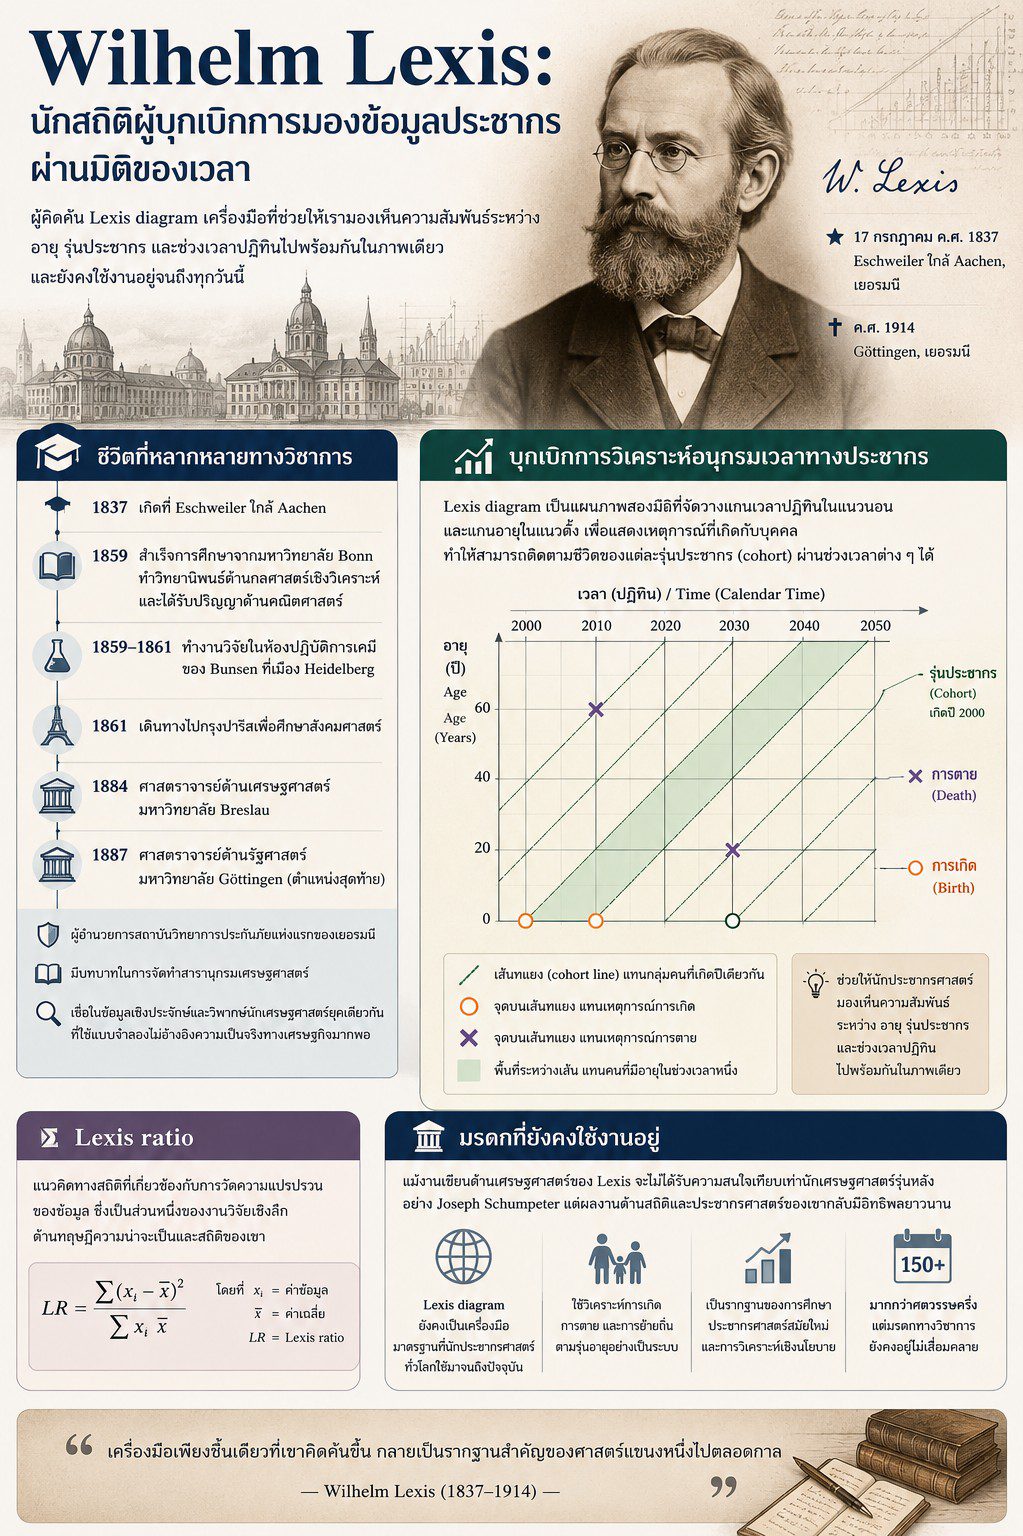
Wilhelm Hector Richard Albrecht Lexis was born on July 17, 1837, in Eschweiler, near the city of Aachen, Germany, and died in 1914 in Göttingen. He had a broad range of interests from a young age, including law, natural sciences, and mathematics.
Lexis graduated from the University of Bonn in 1859, completing a dissertation on analytical mechanics and earning a degree in mathematics. Afterward, he conducted research in Bunsen’s chemistry laboratory in Heidelberg before changing his academic path once again in 1861 by traveling to Paris to study the social sciences. This diverse academic background shaped Lexis into a scholar who approached economics and statistics through a strong empirical perspective, distinguishing him from the “pure” mathematical economists of his time. He often criticized them for relying on models that were insufficiently connected to the realities of economic life.
Throughout his career, Lexis held academic positions at several universities before becoming a professor of economics at the University of Breslau in 1884. In 1887, he moved to the University of Göttingen to serve as a professor of political science, a position that became the final academic role of his career. In addition to his research, he served as director of Germany’s first institute of insurance science and played a role in the creation of an encyclopedia of economics.
Pioneering the Analysis of Demographic Time Series
Although Lexis wrote extensively across various fields, including demography, economics, and mathematical statistics, the work that has kept his name in academic memory to this day is his approach to studying population data as time series. This pioneering perspective later became an important foundation of modern demography.
Lexis’s most significant contribution was what is now known as the Lexis diagram, a two-dimensional diagram used to represent events affecting individuals, such as births and deaths. It places calendar time on the horizontal axis and age on the vertical axis, allowing the life paths of different population cohorts to be systematically tracked over time. This type of diagram enables demographers to visualize the relationships between age, population cohorts, and calendar periods simultaneously in a single image—something that is difficult to achieve through written descriptions alone.
In addition to the Lexis diagram, he was also known for the Lexis ratio, a statistical concept related to measuring the variability of data. This work formed part of his deeper research into the theories of probability and statistics.
A Legacy That Remains in Use
Although Lexis’s writings on economics did not receive as much recognition from later economists, such as Joseph Schumpeter, his contributions to statistics and demography had a lasting impact. The Lexis diagram remains a standard tool used by demographers around the world to explain and analyze data on births, deaths, and population changes across different age cohorts to this day, even more than a century and a half after its creation.
The name Wilhelm Lexis stands as another example of a scholar whose broader body of work may not have been widely recognized during his lifetime, yet a single tool he developed became a lasting foundation of an entire field of study.